0
Skip to Content
Contact
Results
Open Menu
Close Menu
Contact
Results
Open Menu
Close Menu
Contact
Results
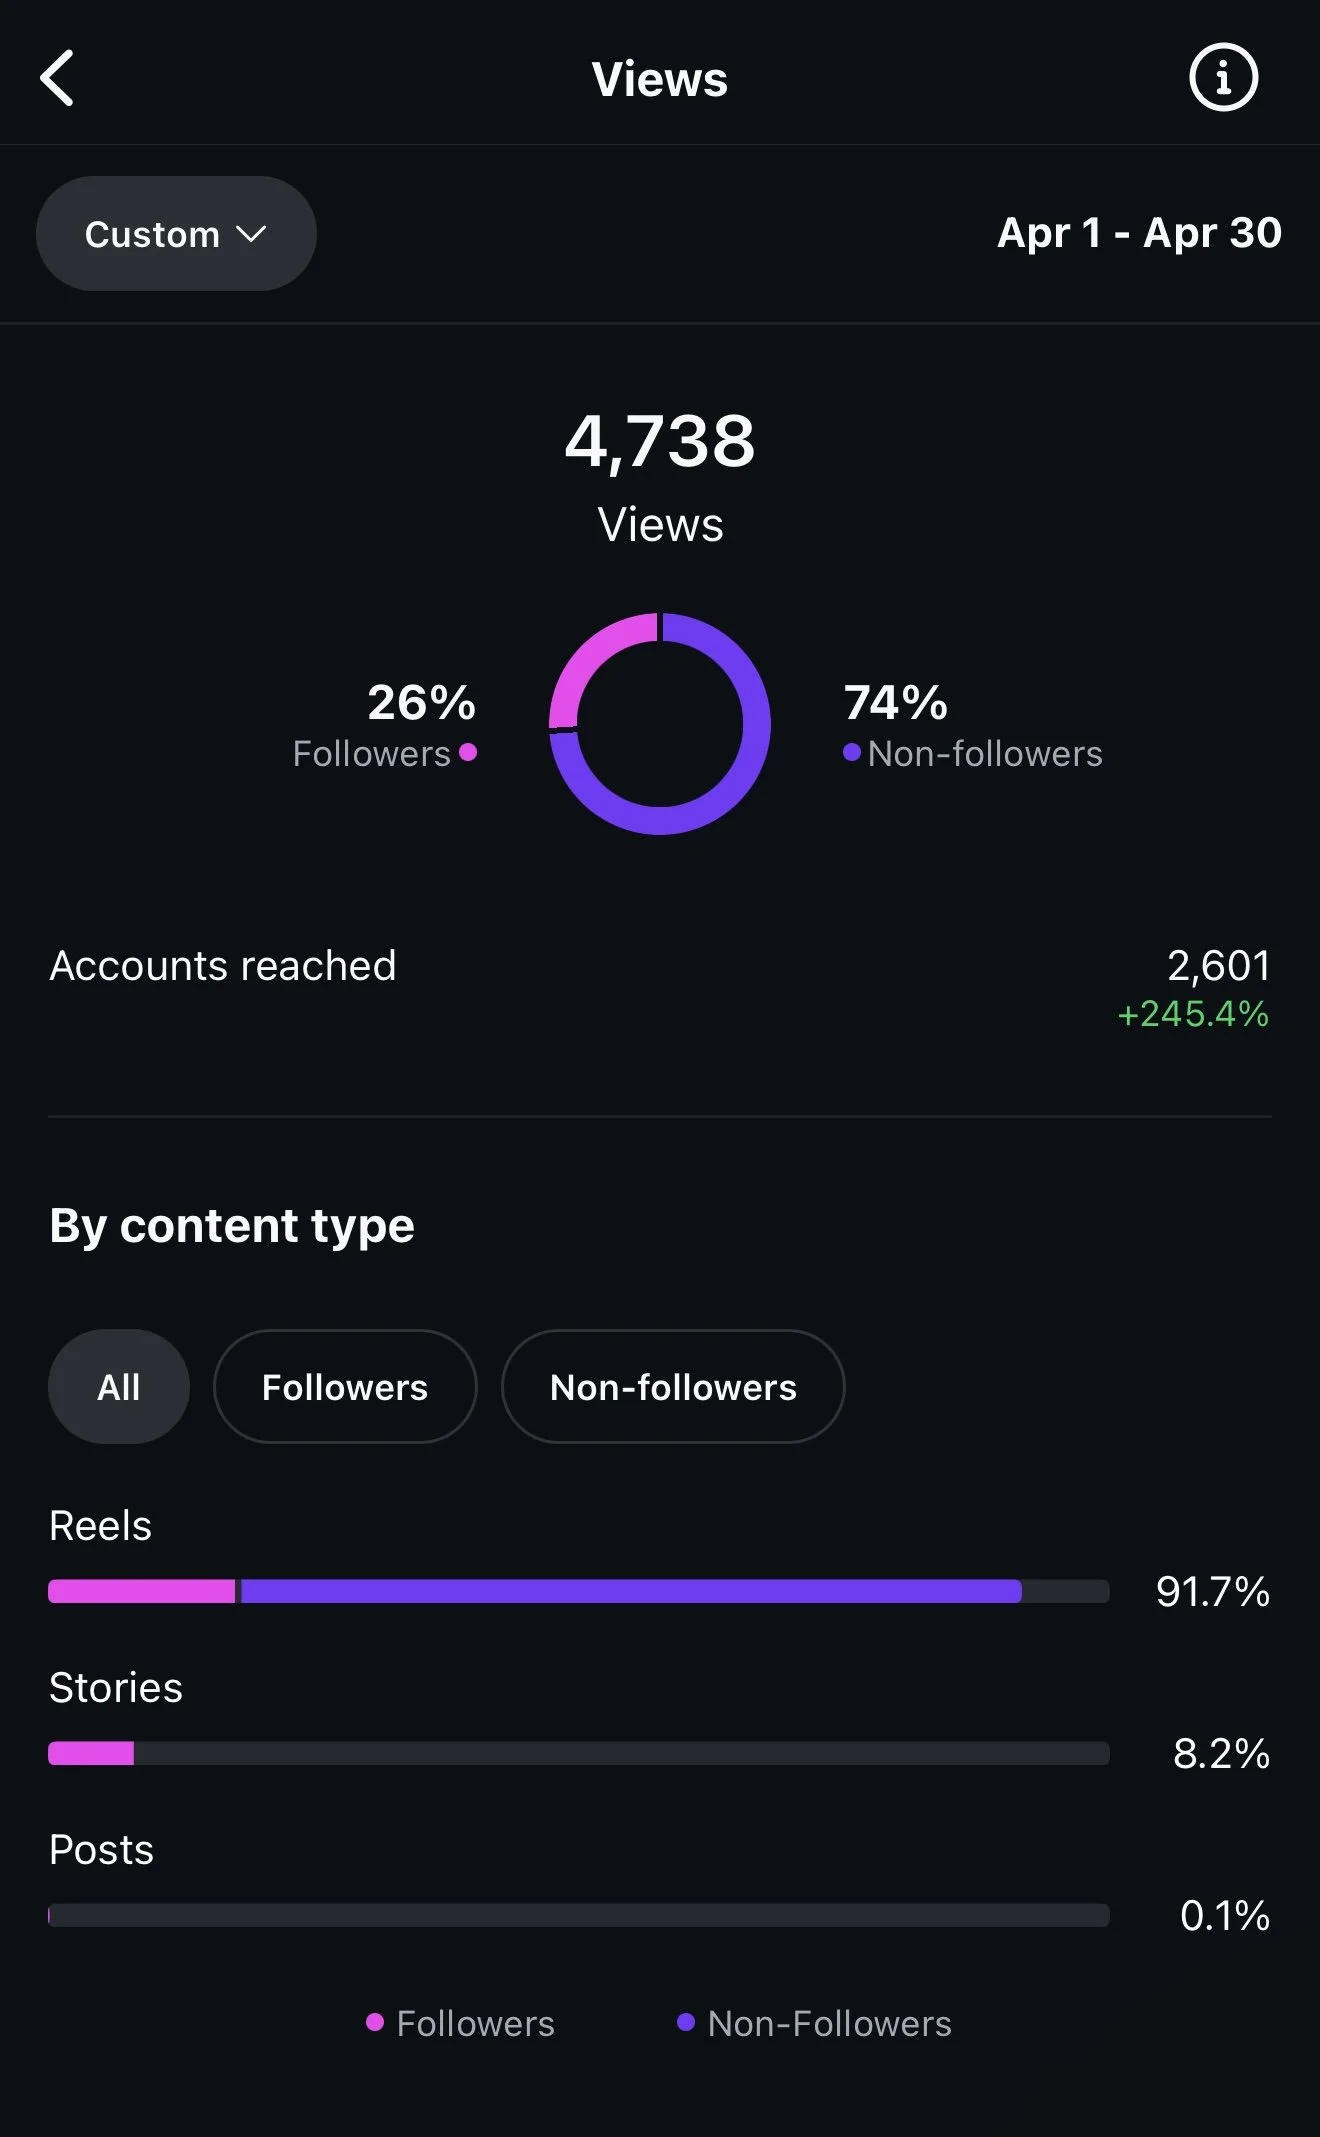
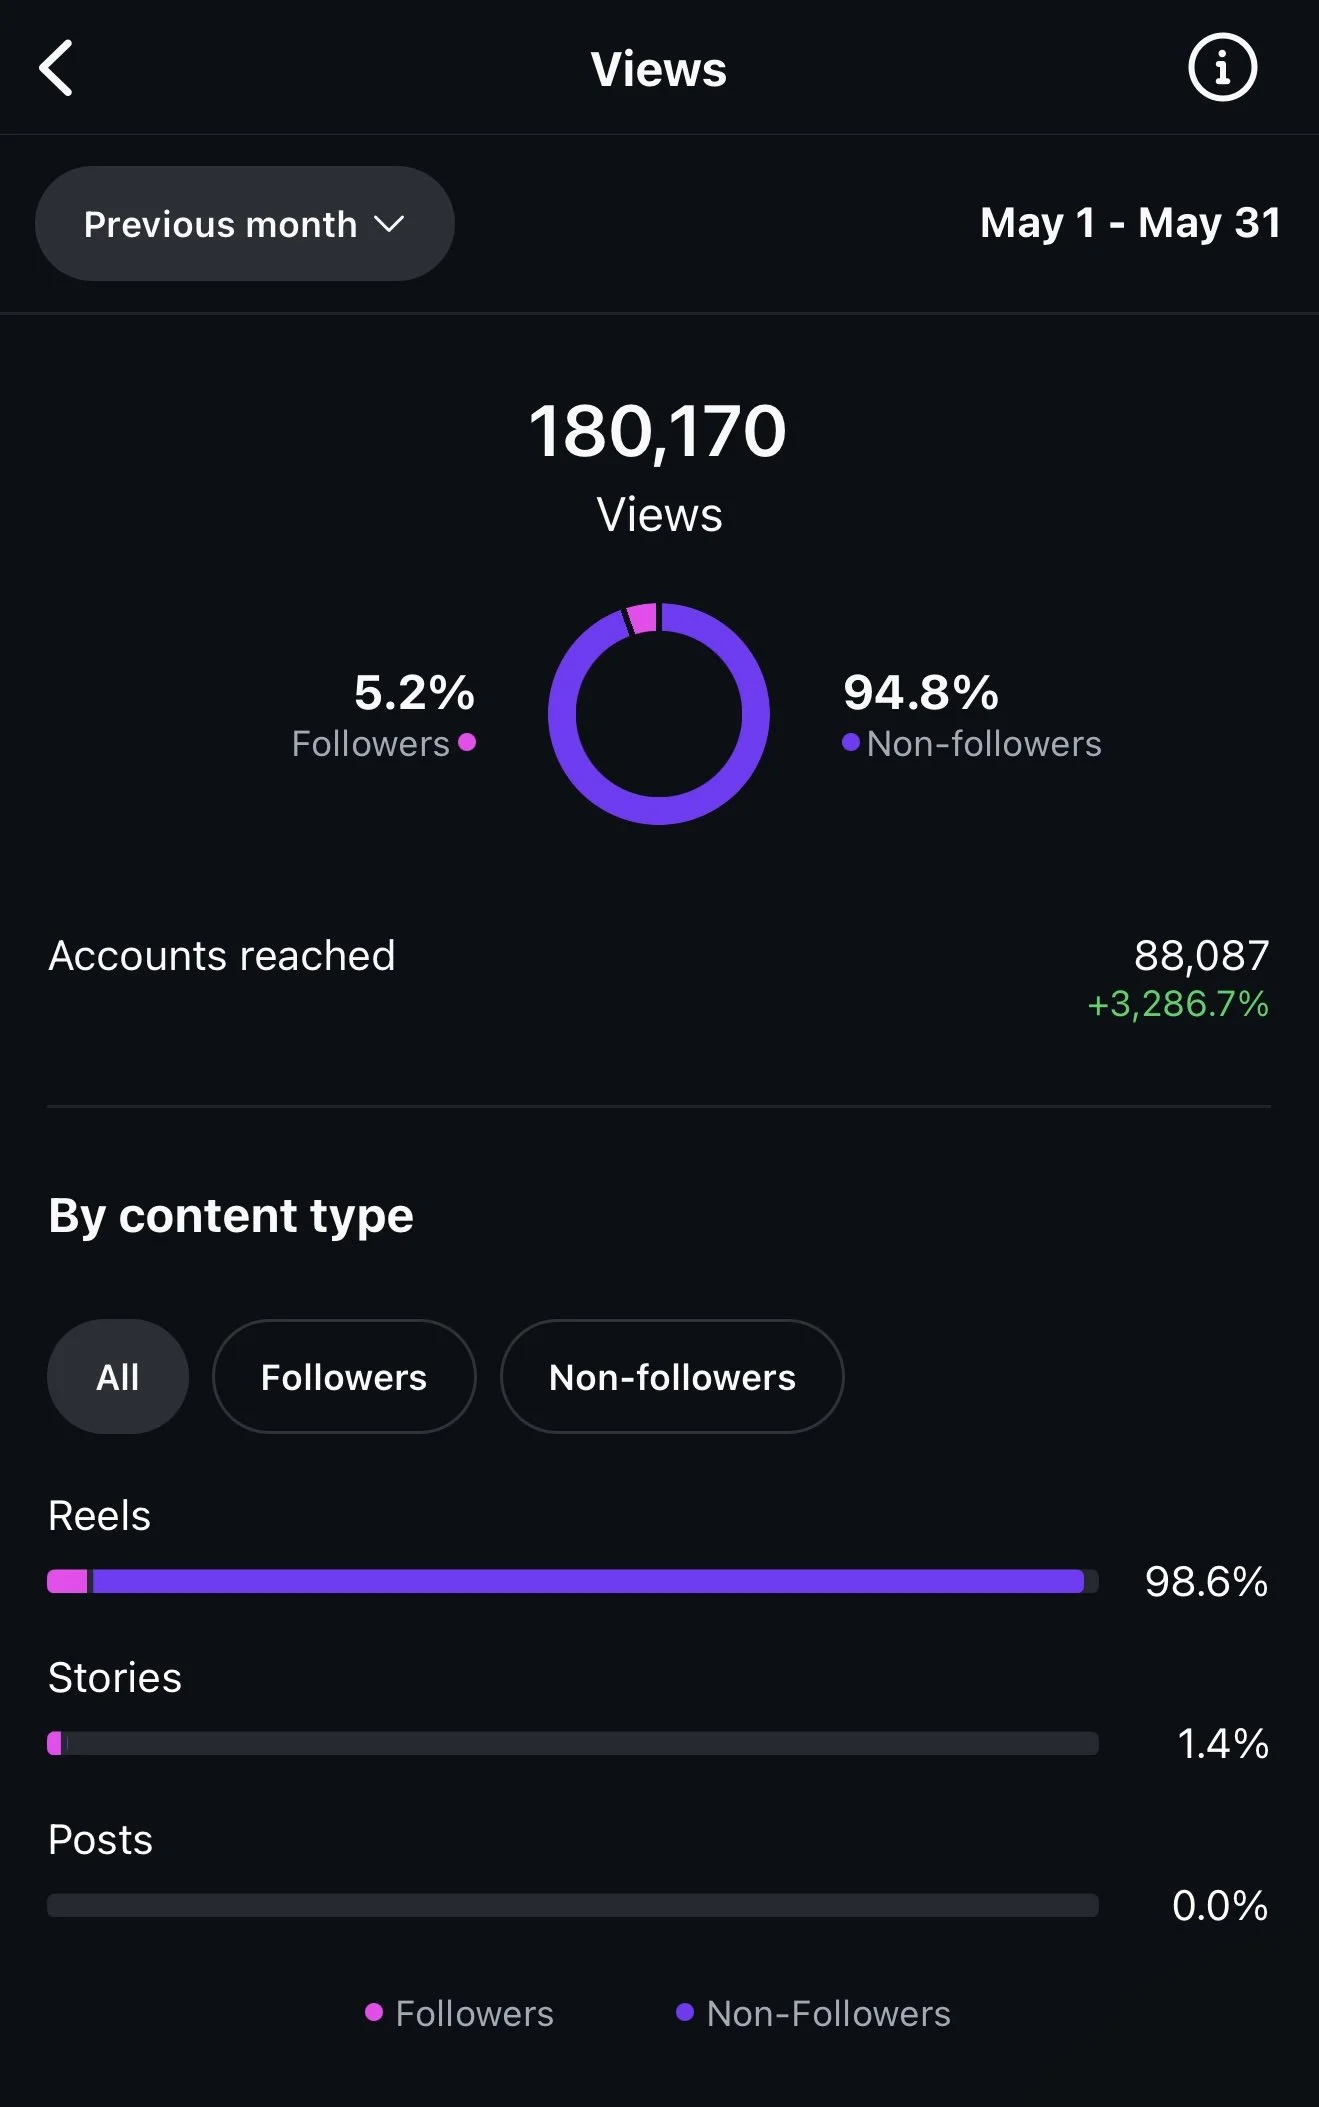
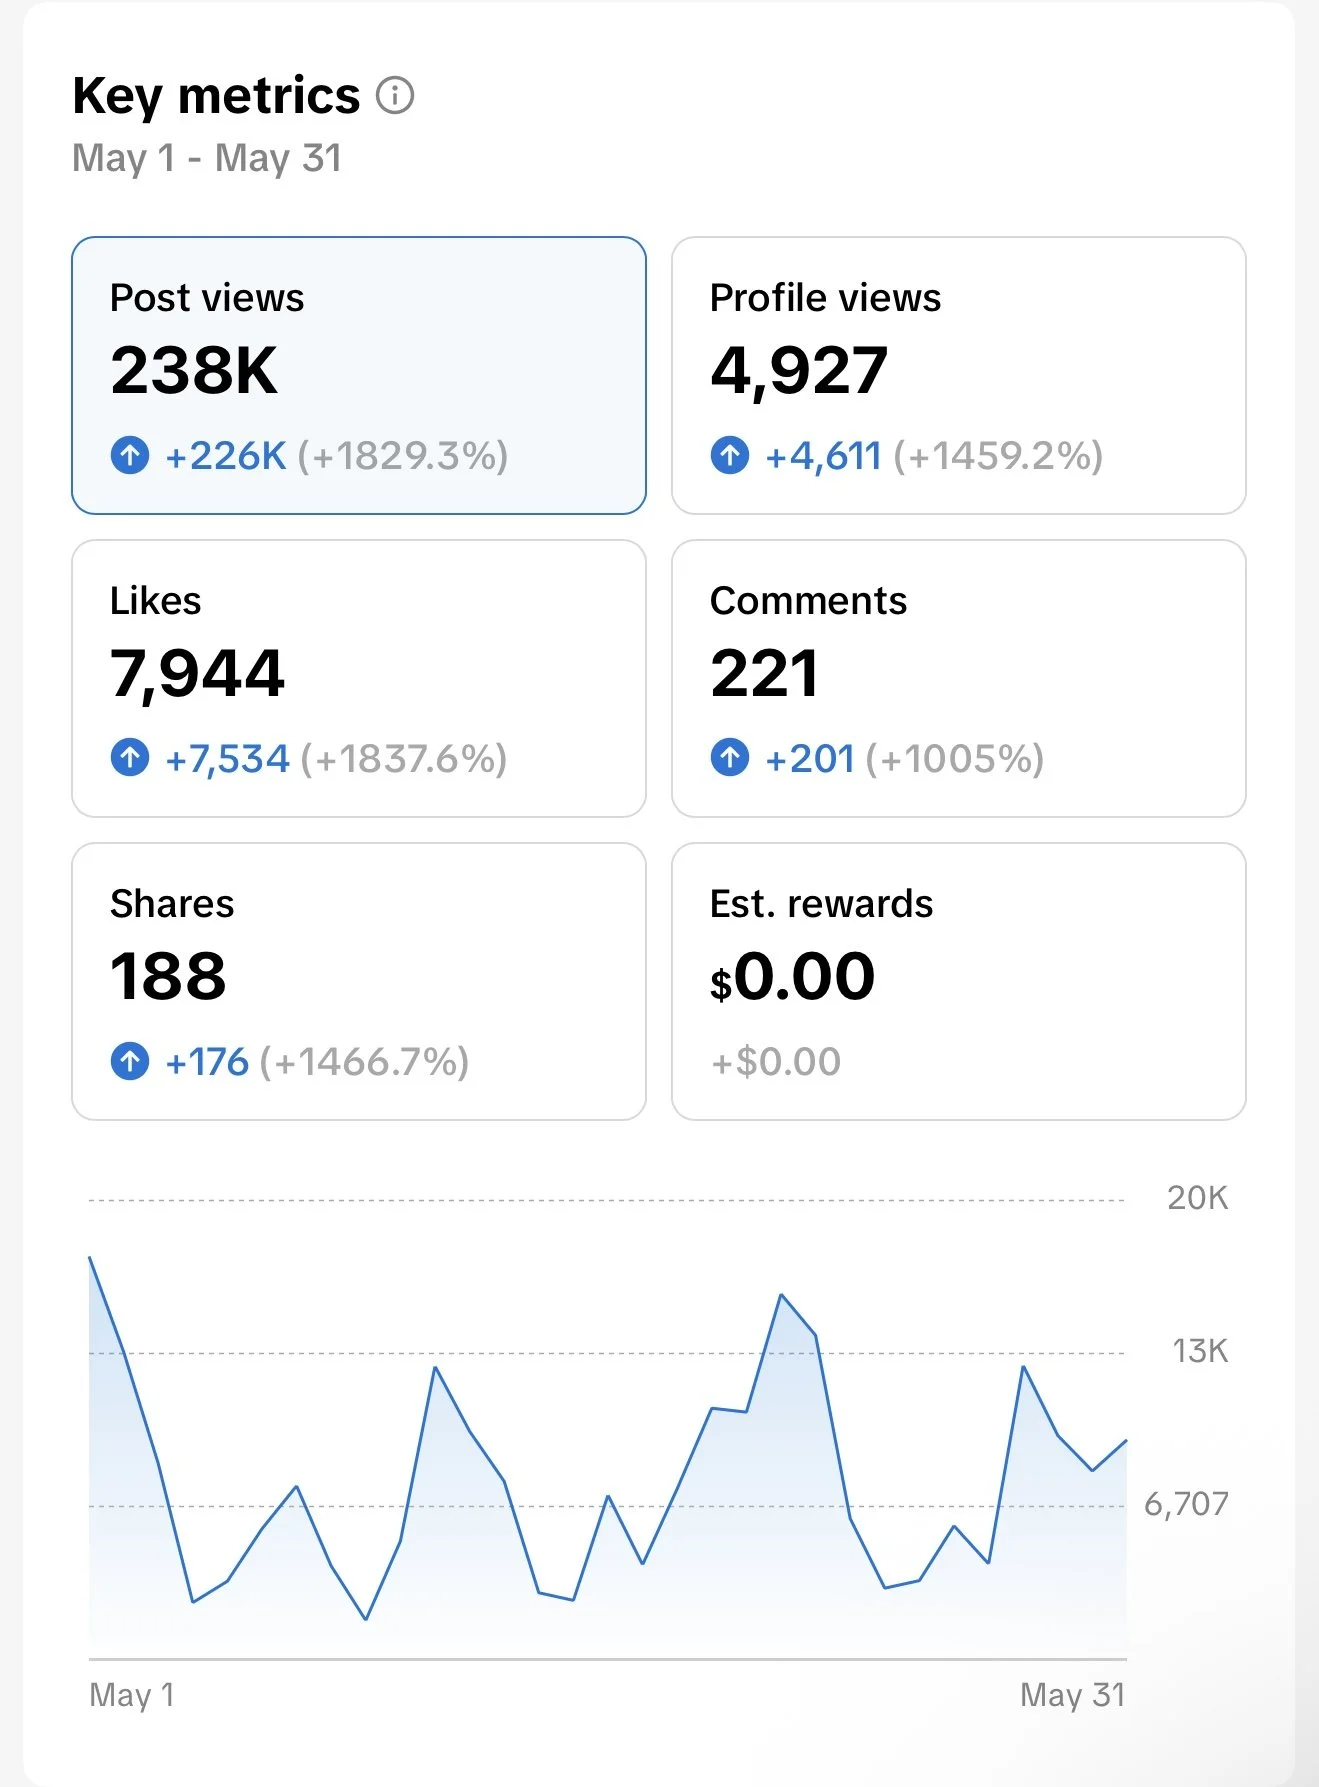
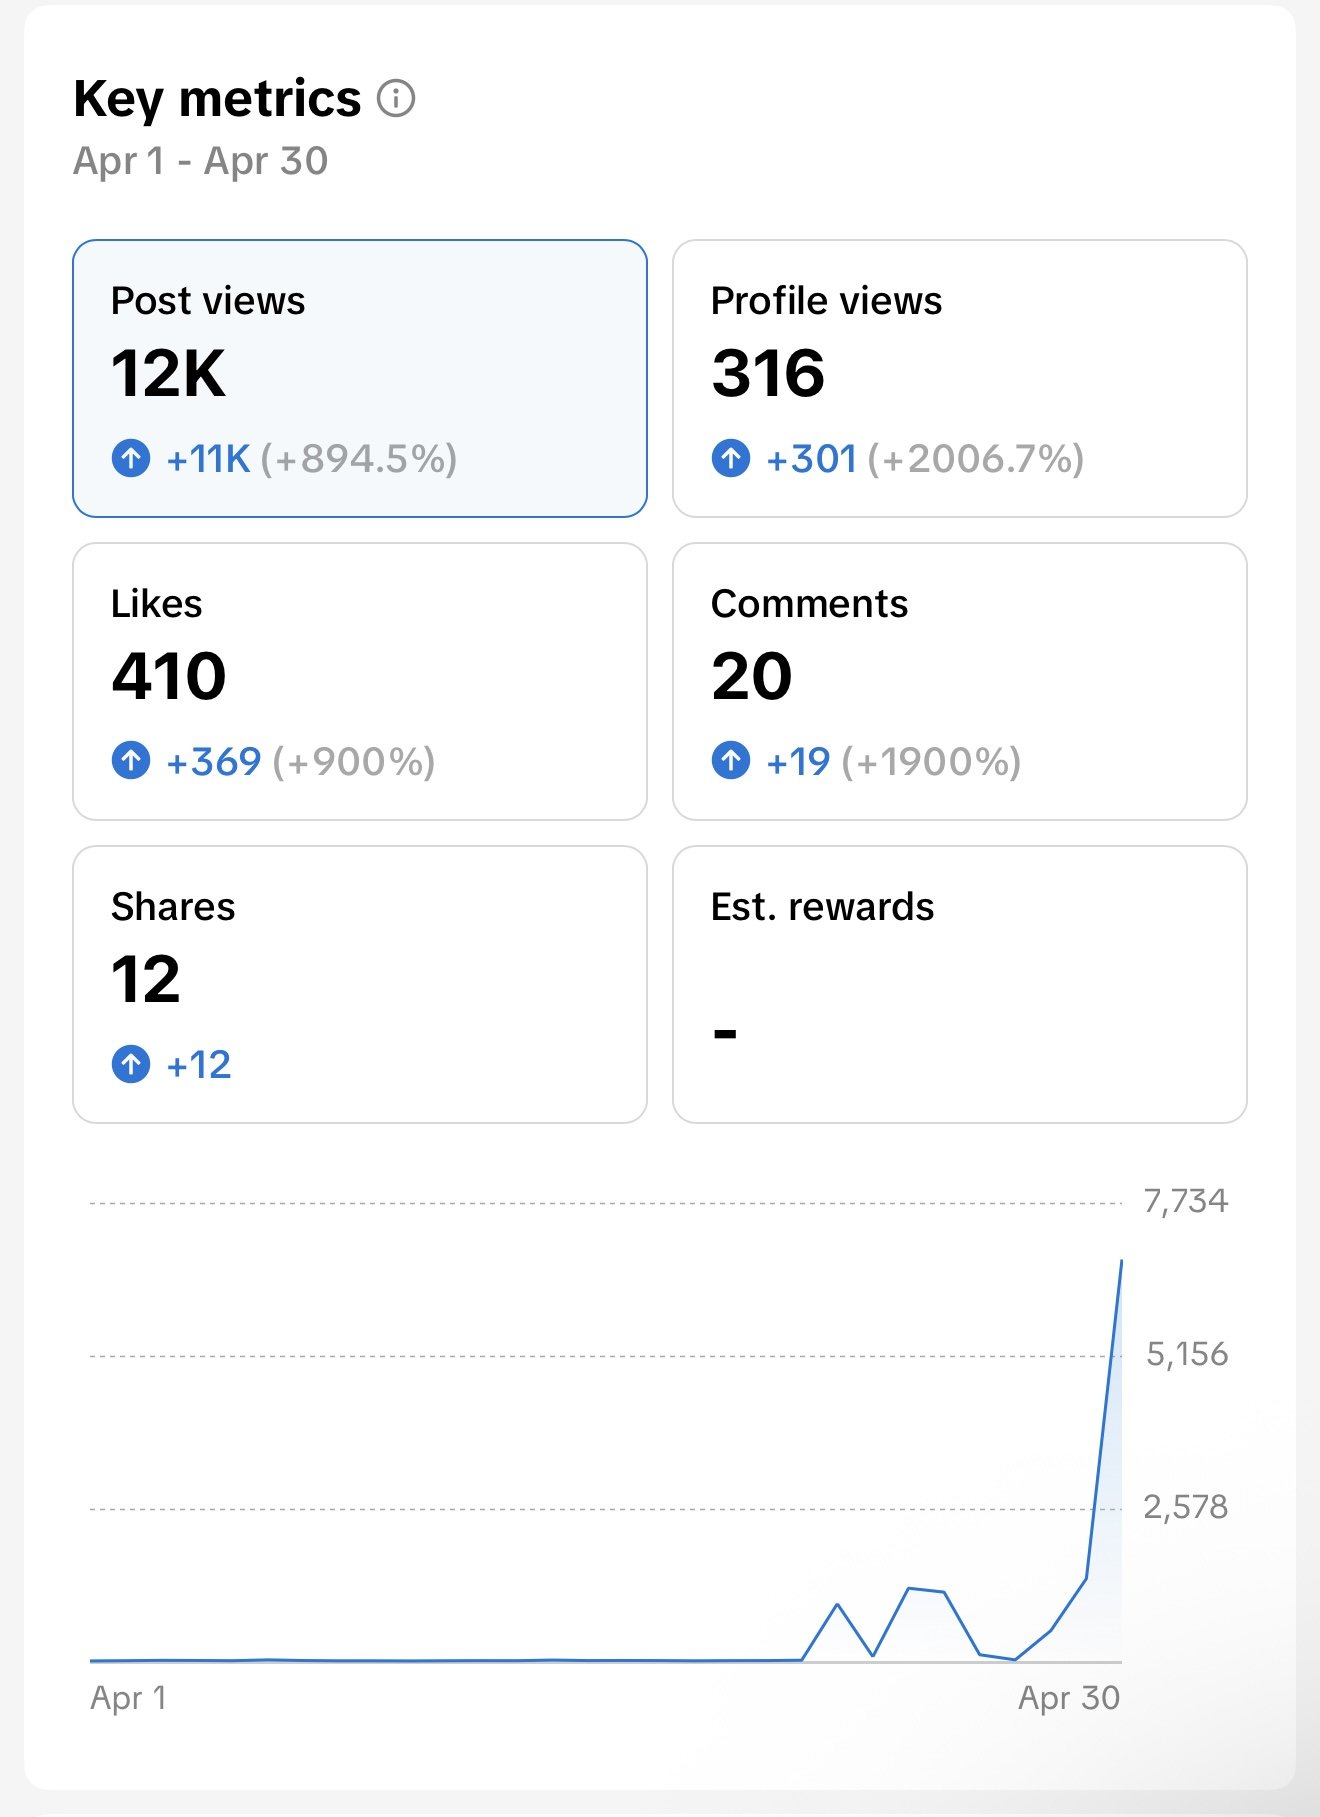
Analytics
Instagram Growth in One Month
TikTok Growth in One Month